
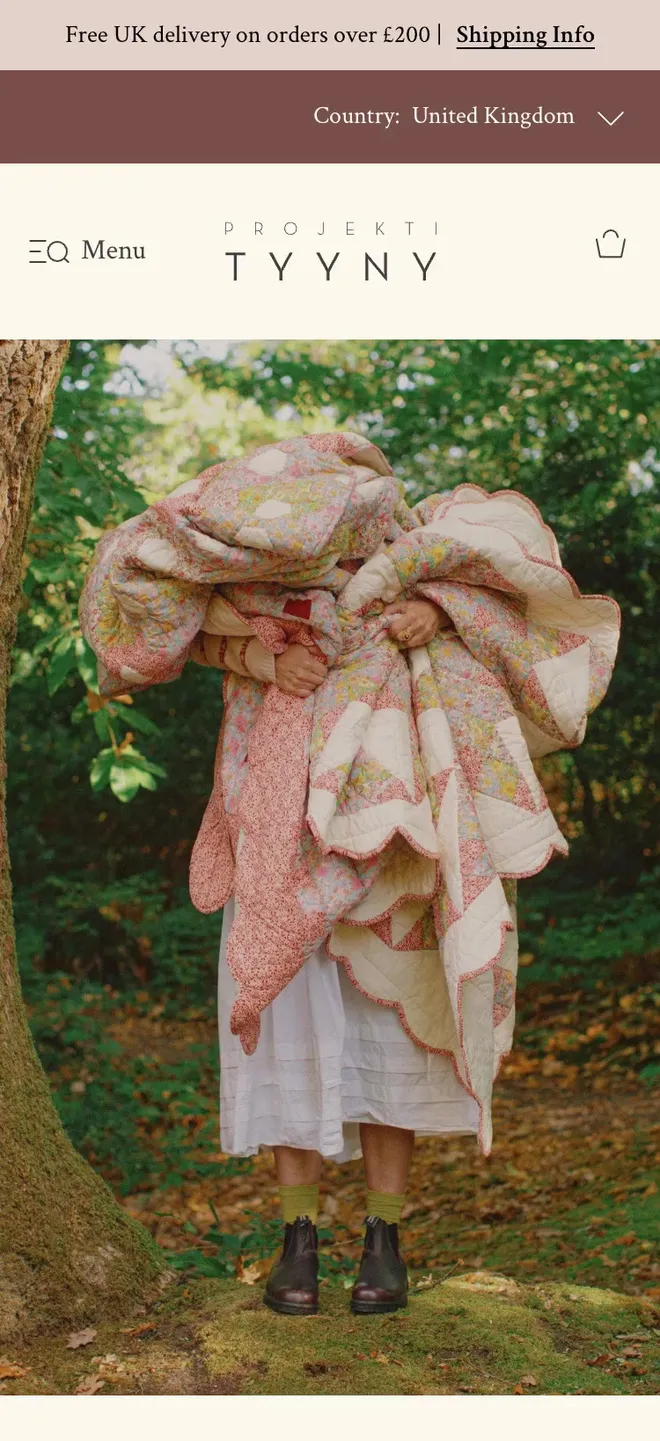
Projektityyny. A mobile-first store launch for a Nordic-inspired textiles brand



Food & drink · August 2025
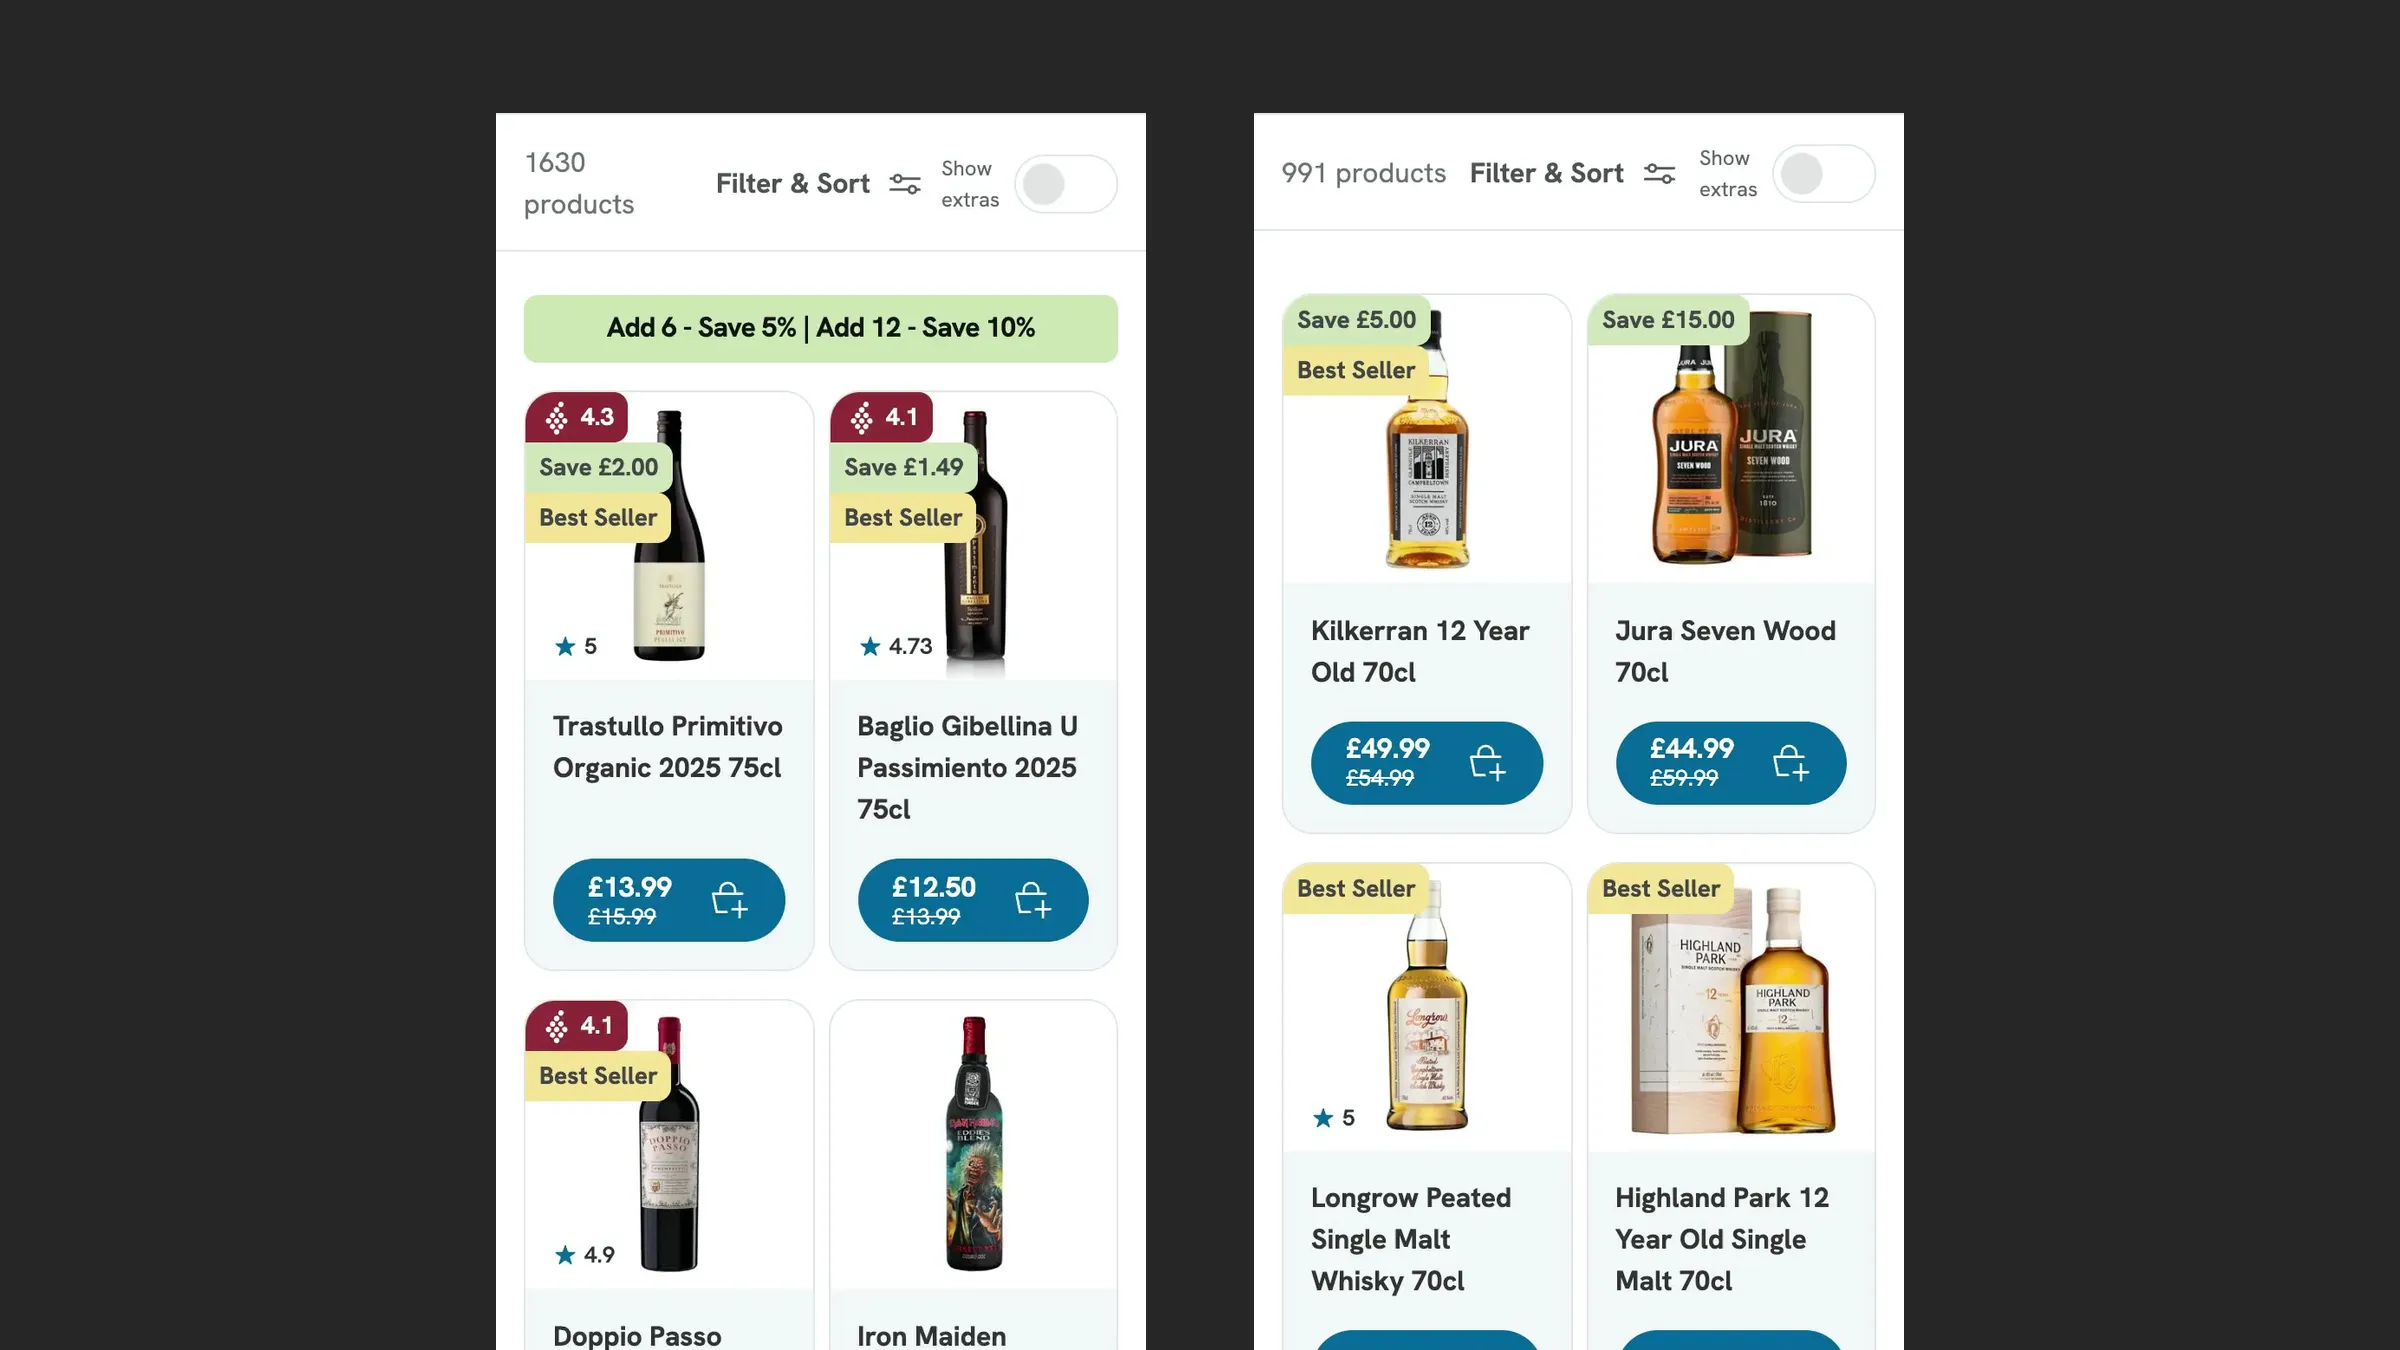
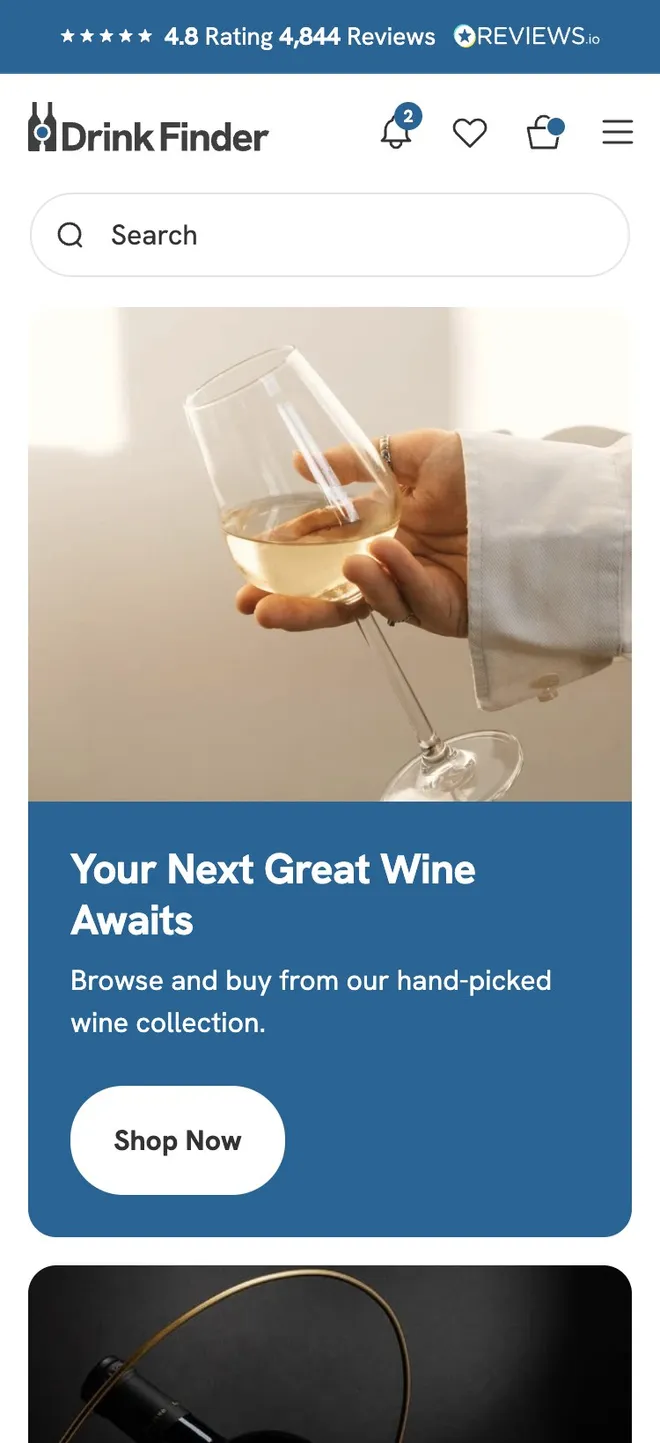
September to February vs the same months a year earlier. EPoS till data, marketplaces excluded.

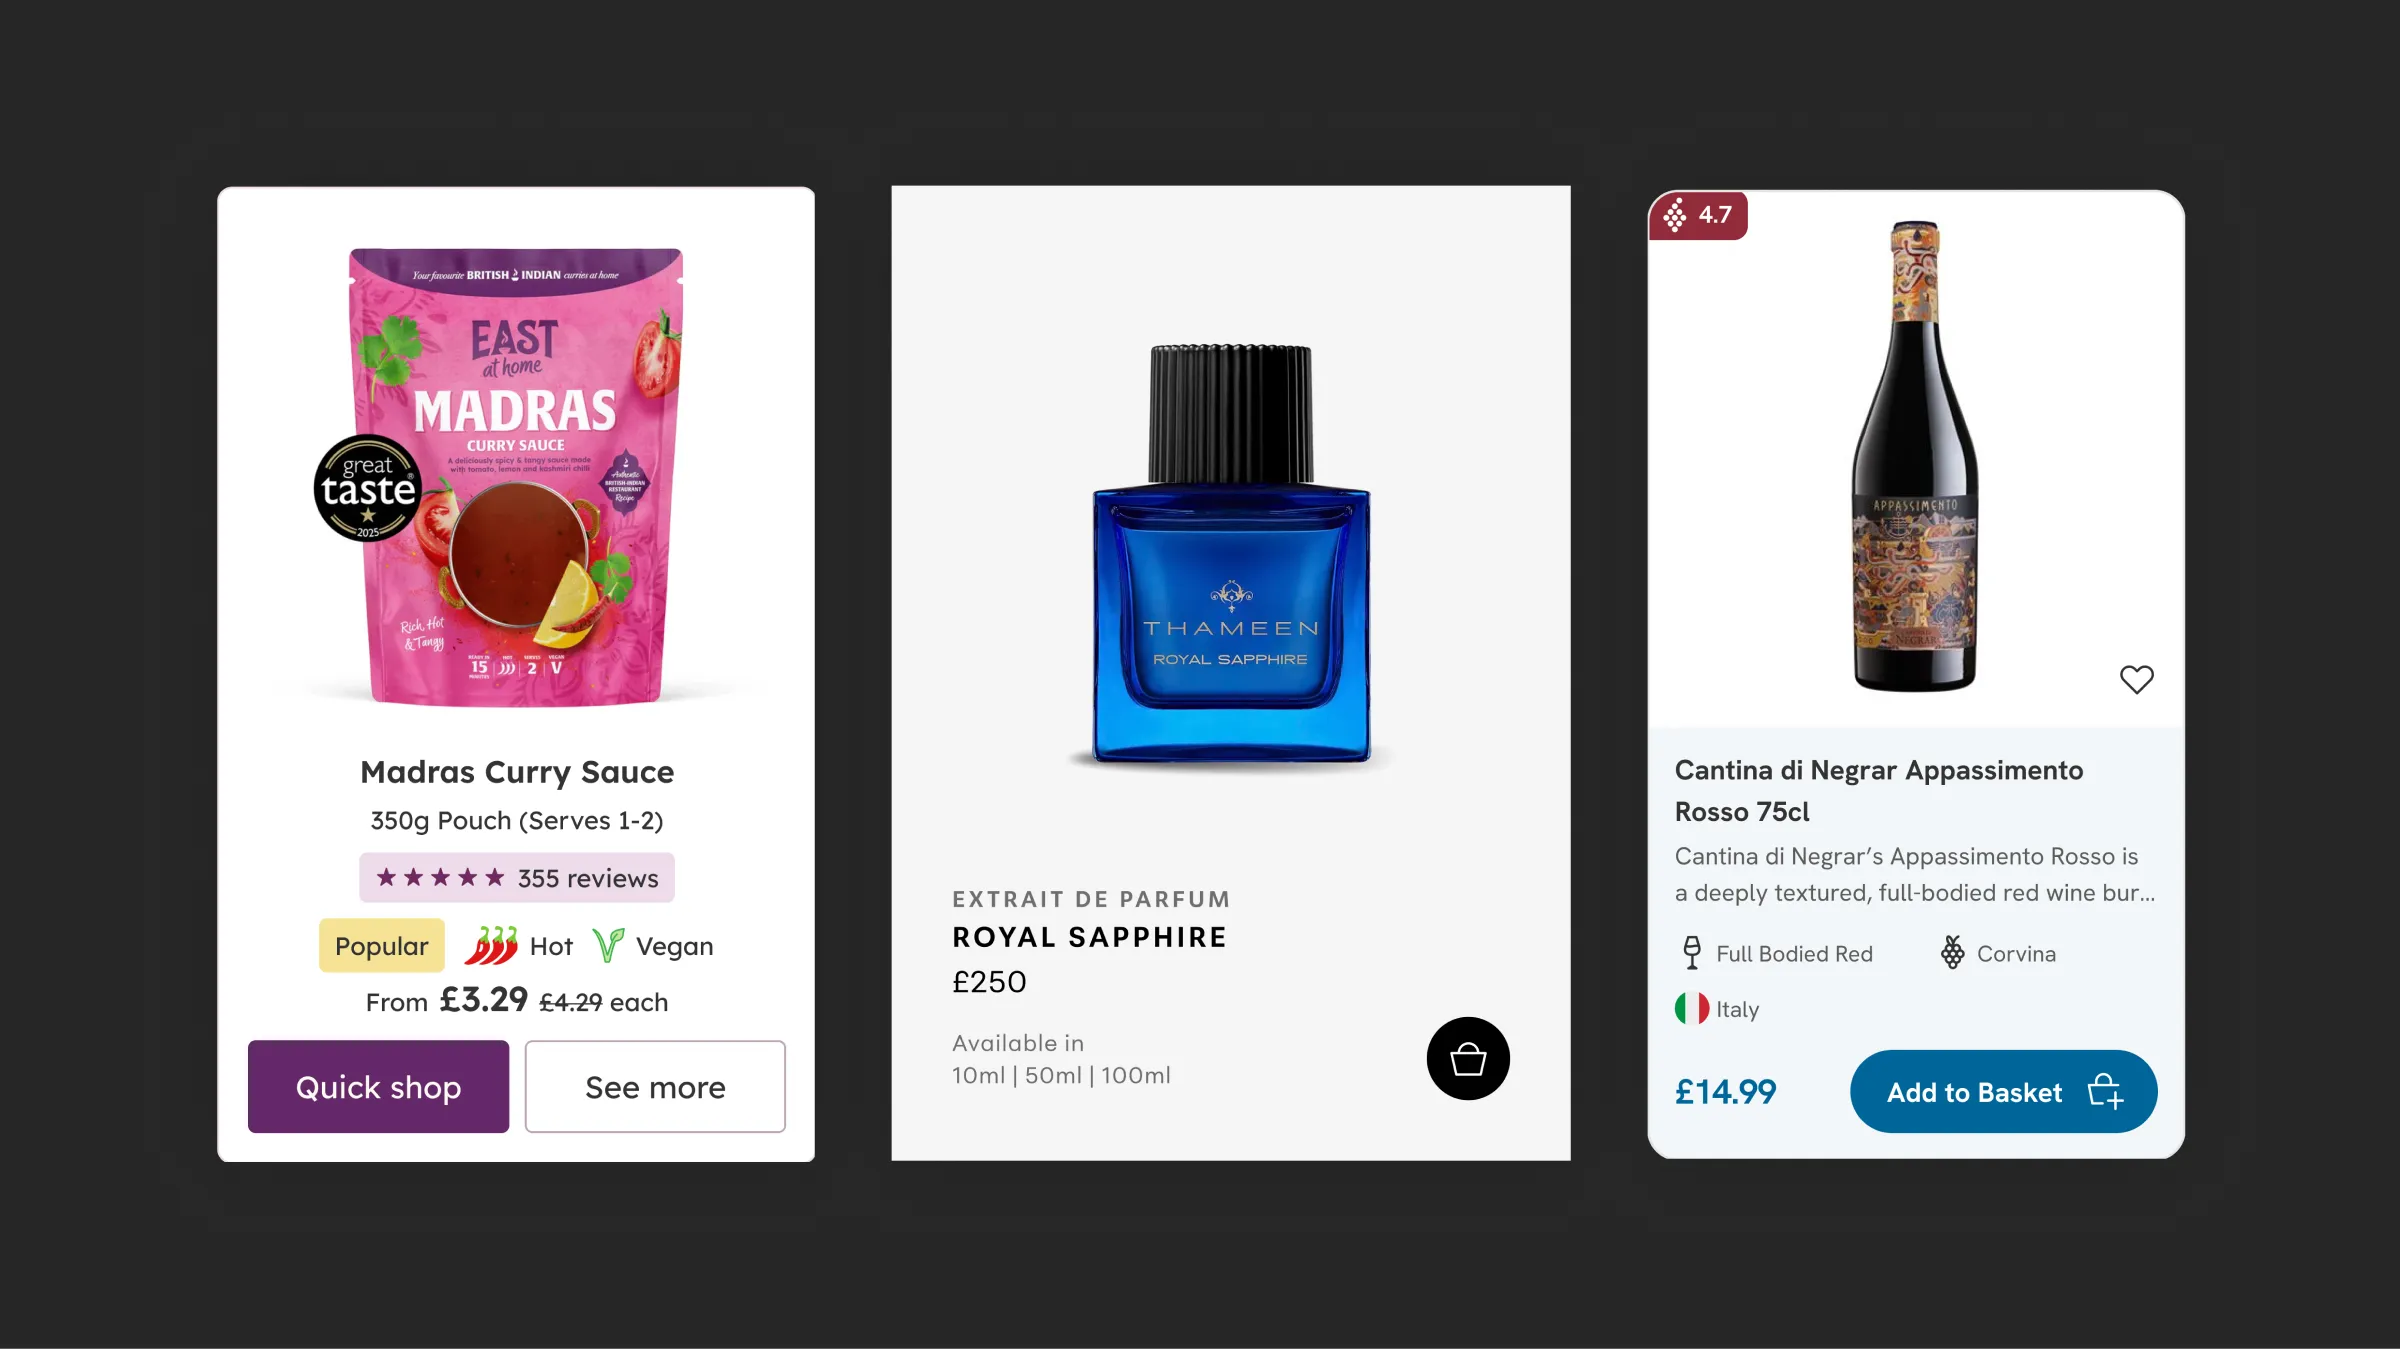
Food & drink · October 2025
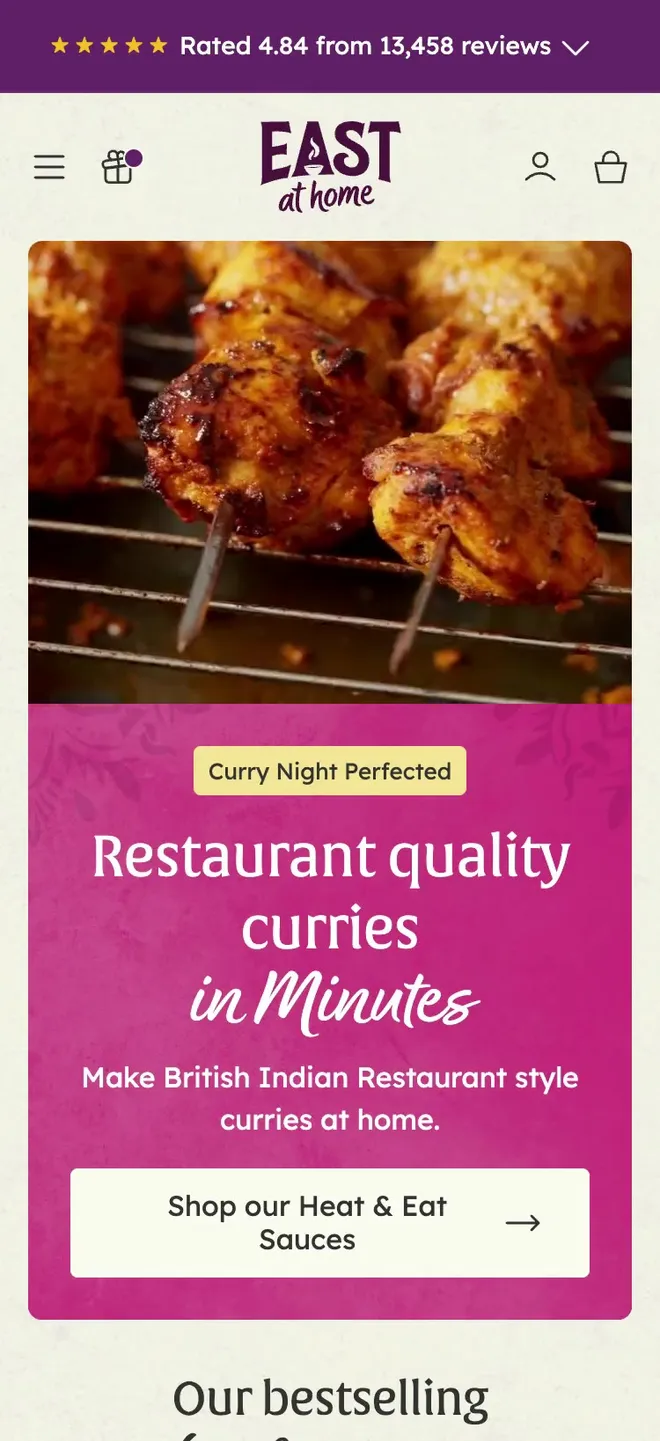
October to June vs the same months a year earlier. GA4, UK sessions.
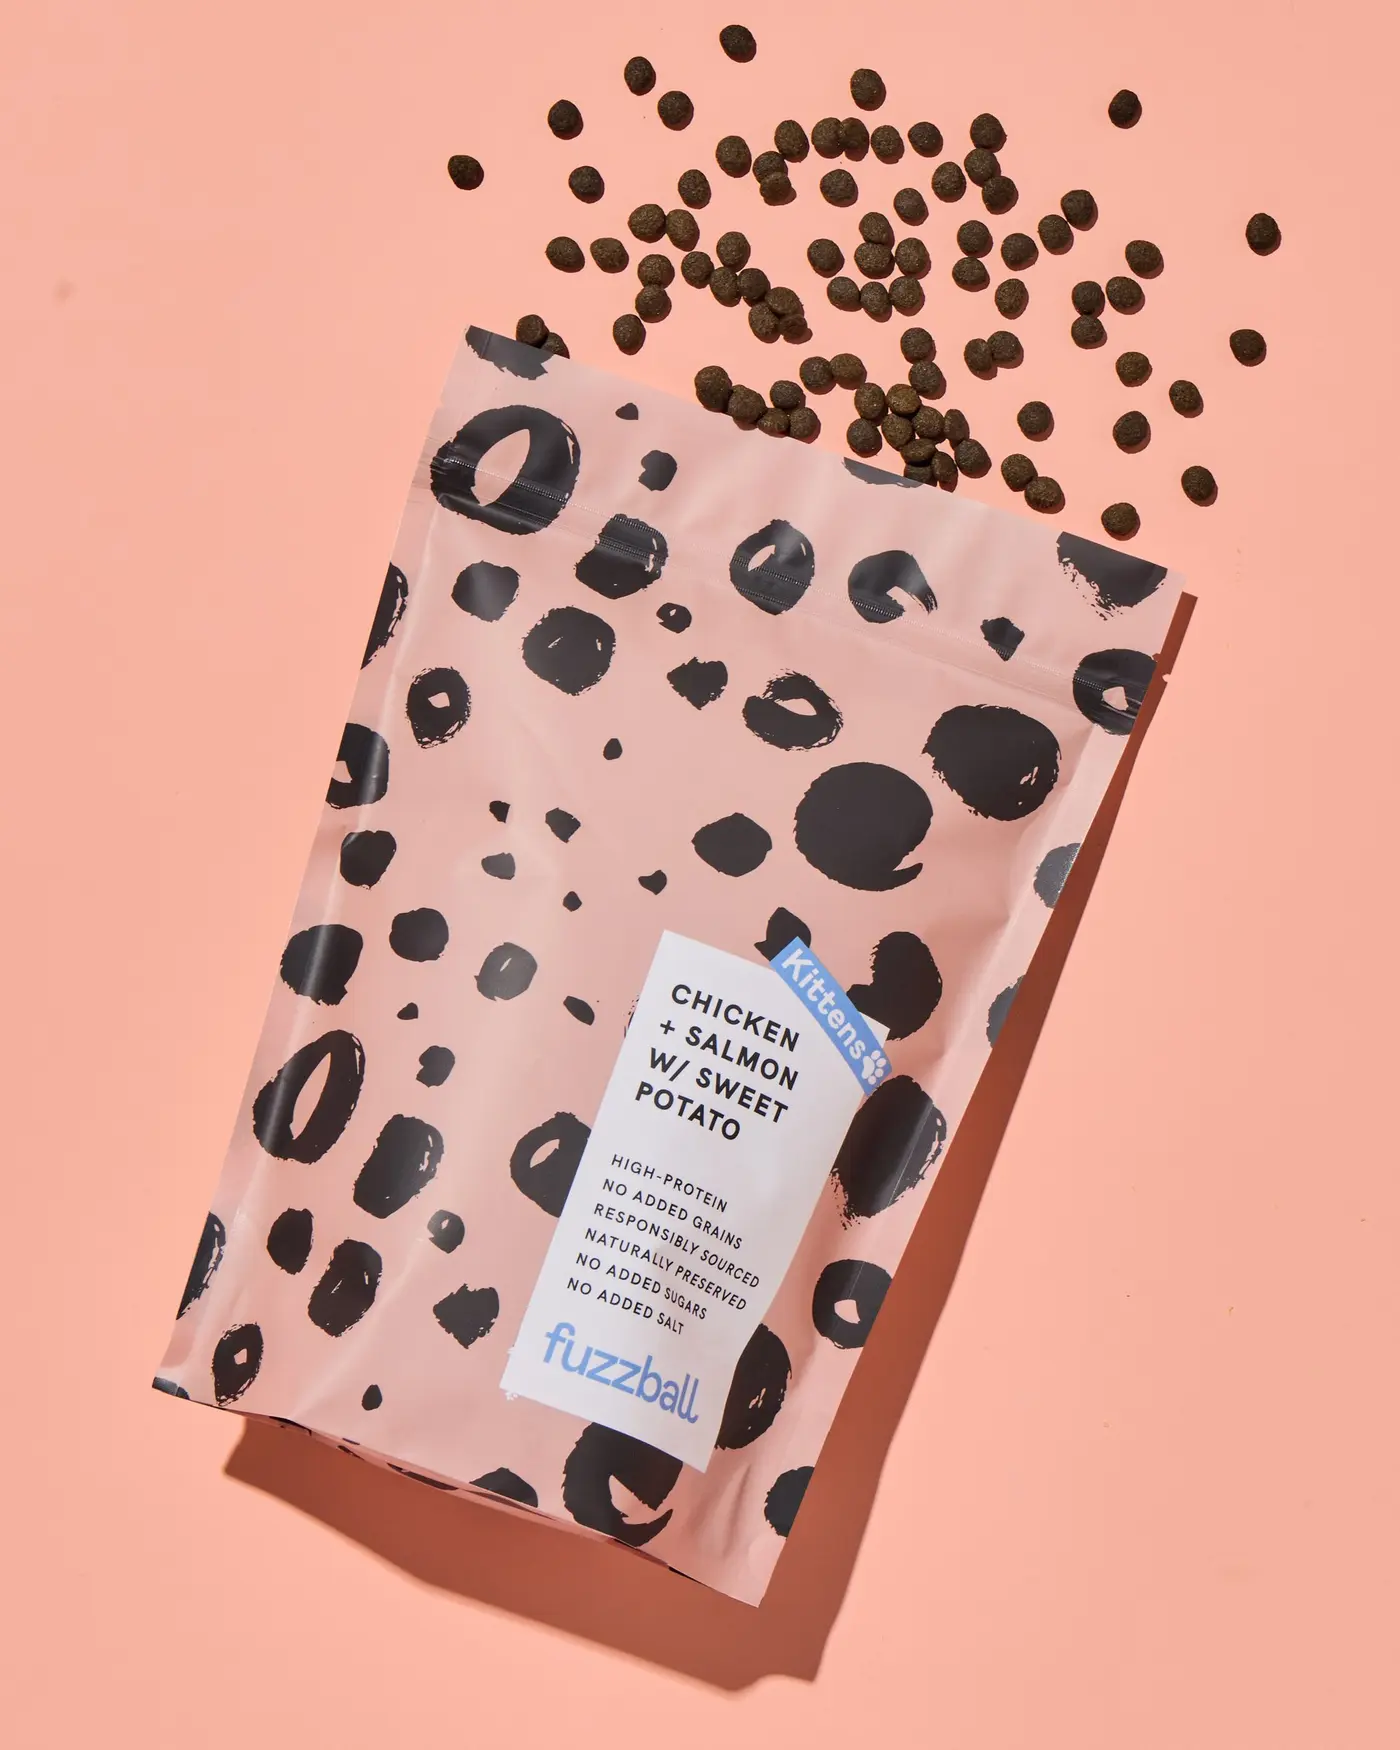
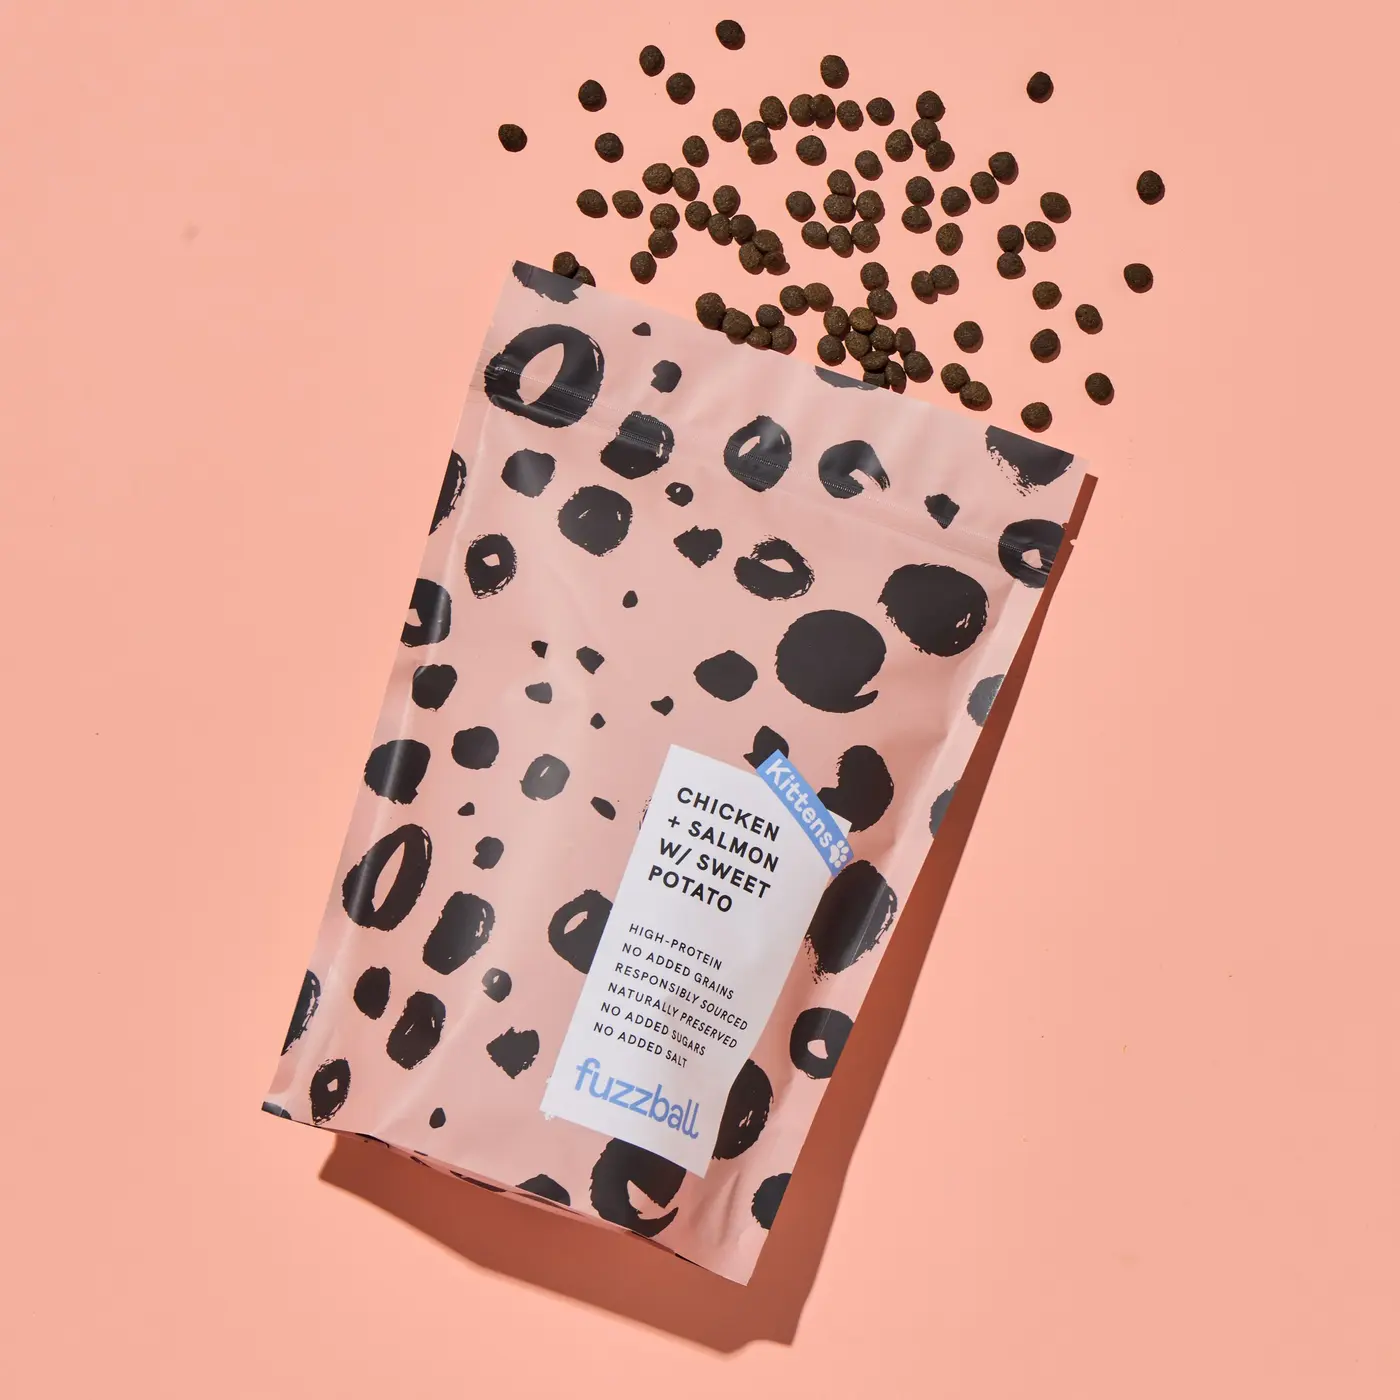
Pets · August 2025
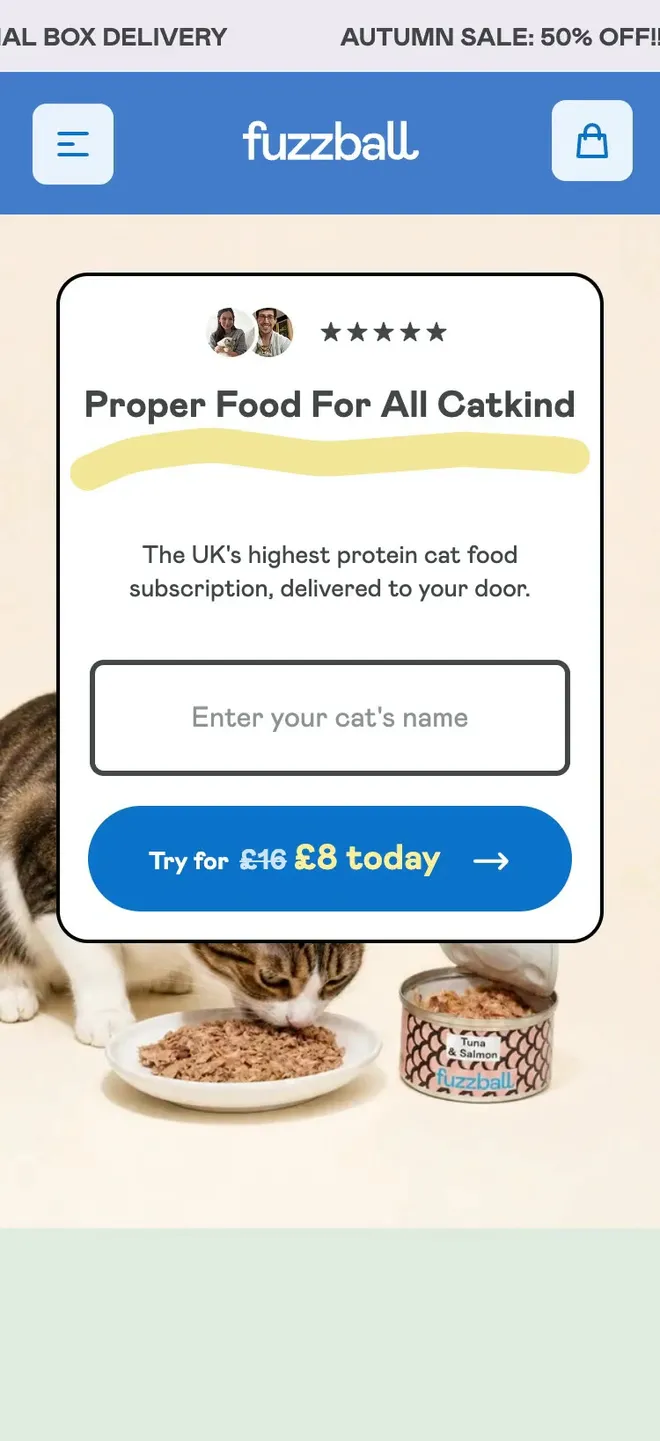
August 2025 to August 2026 vs the same months a year earlier. GA4.

Home · June 2026
Every past collection stays live as a shoppable lookbook, so campaign photography keeps earning traffic.

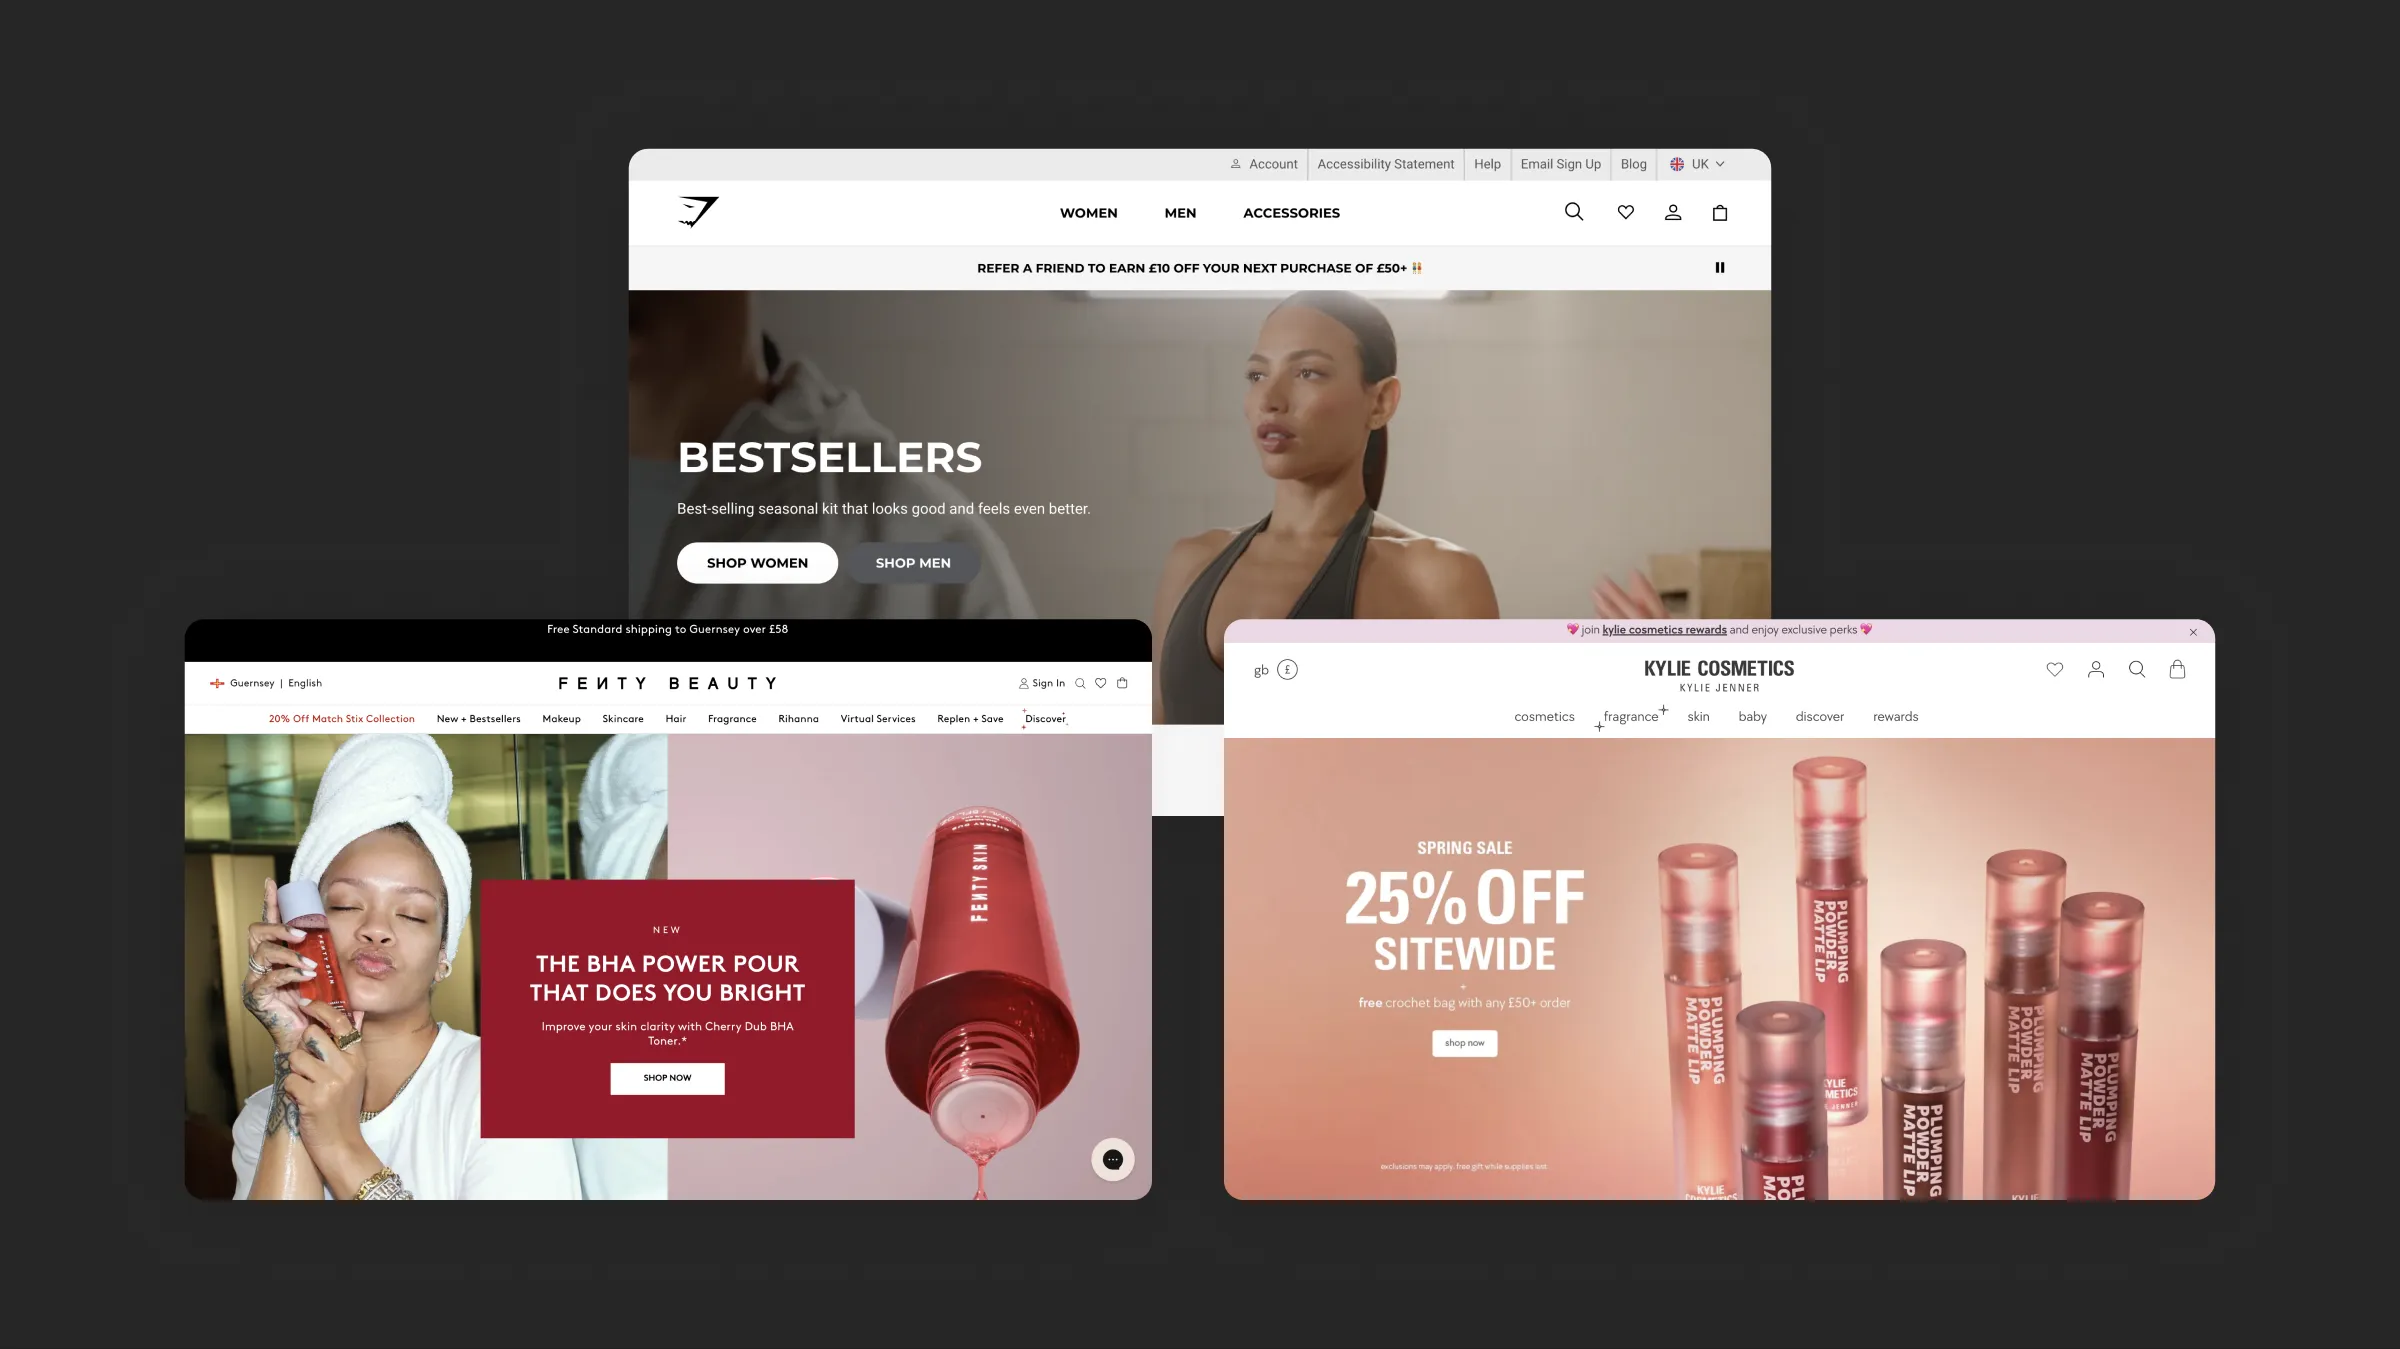
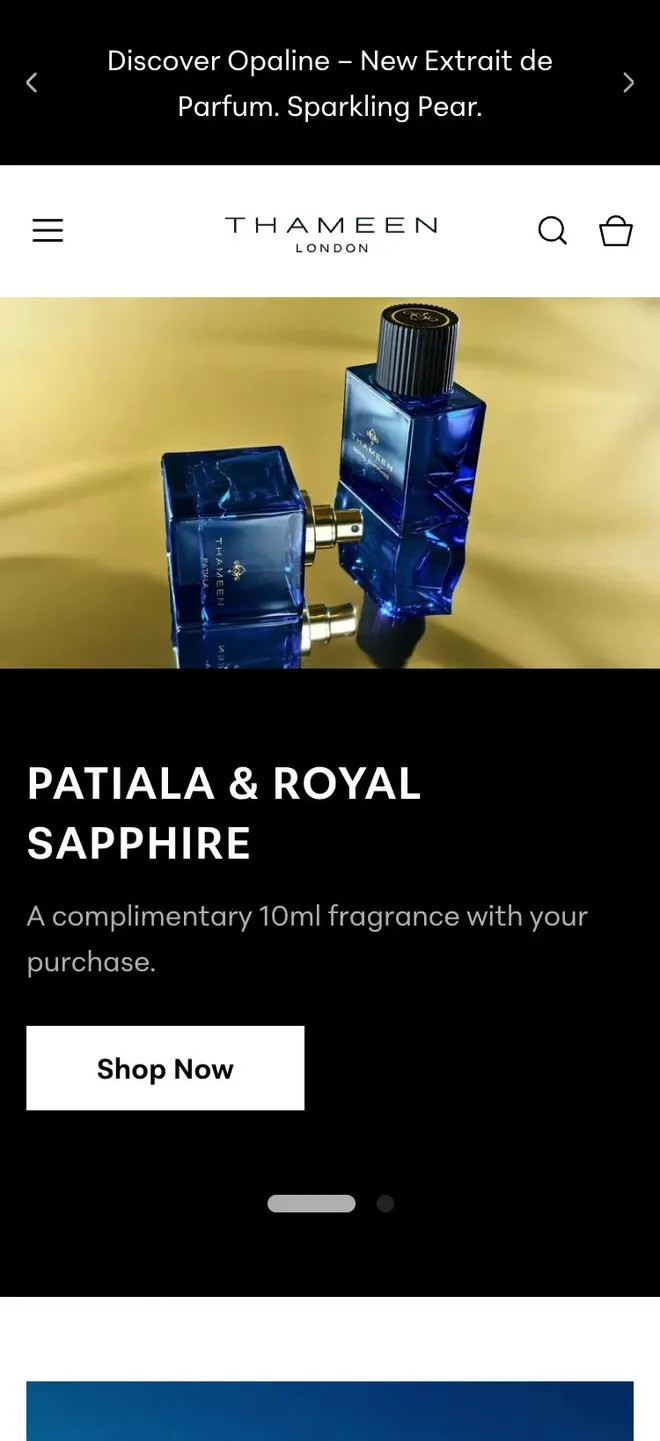
Beauty · March 2026
"A journey that feels both effortless for the customer and truly reflective of Thameen's luxury positioning." Nour Abdel-Motaal

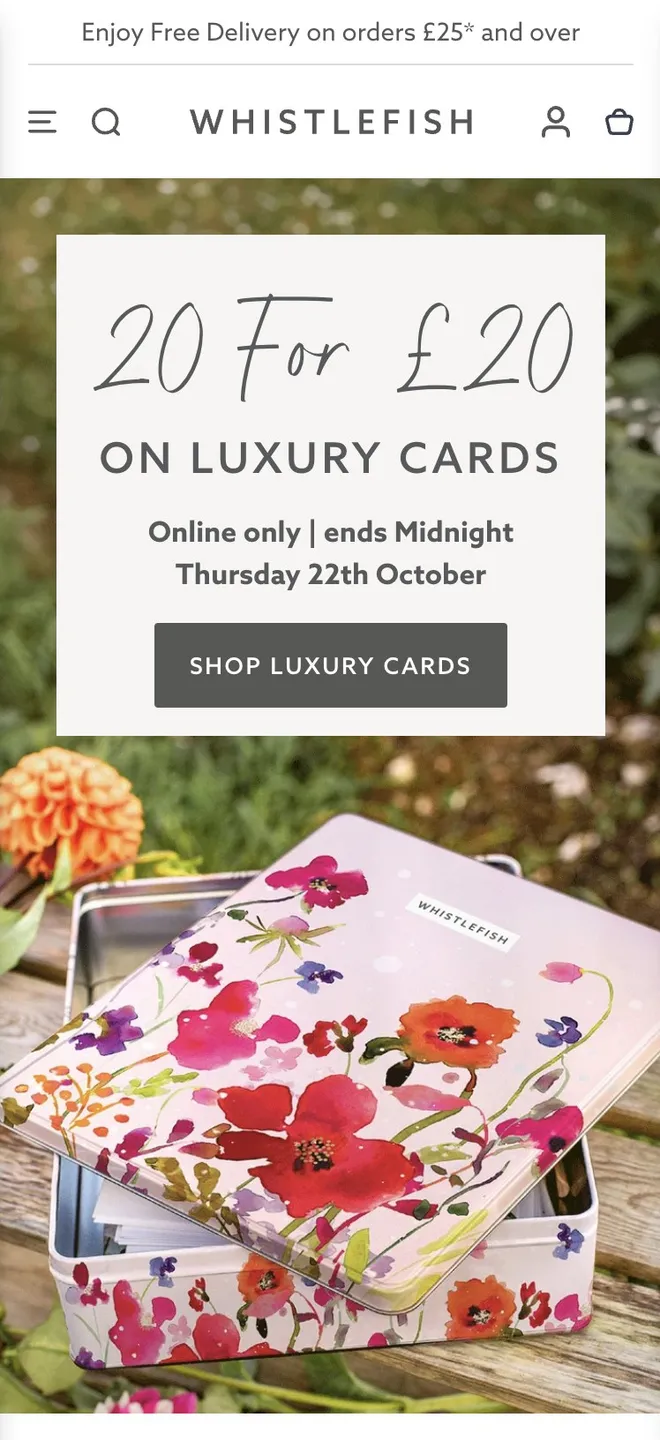
Stationery & gifts · April 2025
"We've since been able to carry that framework into our own design team." Will Manders
 5.0on Google, read the client reviews

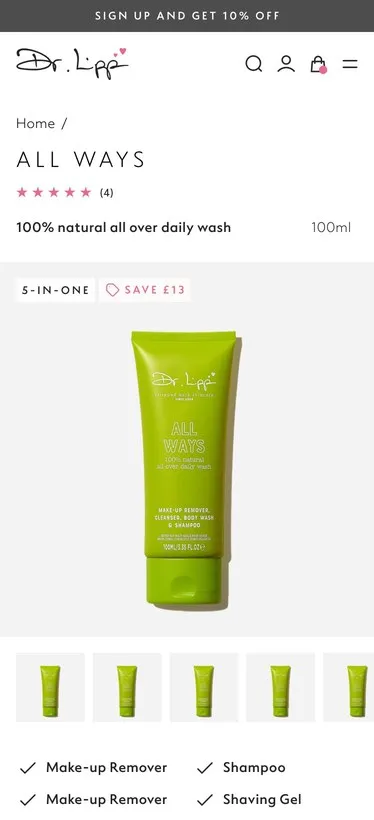
Beauty · May 2024
May 2024 to February 2025 vs the previous period. Shopify Analytics.

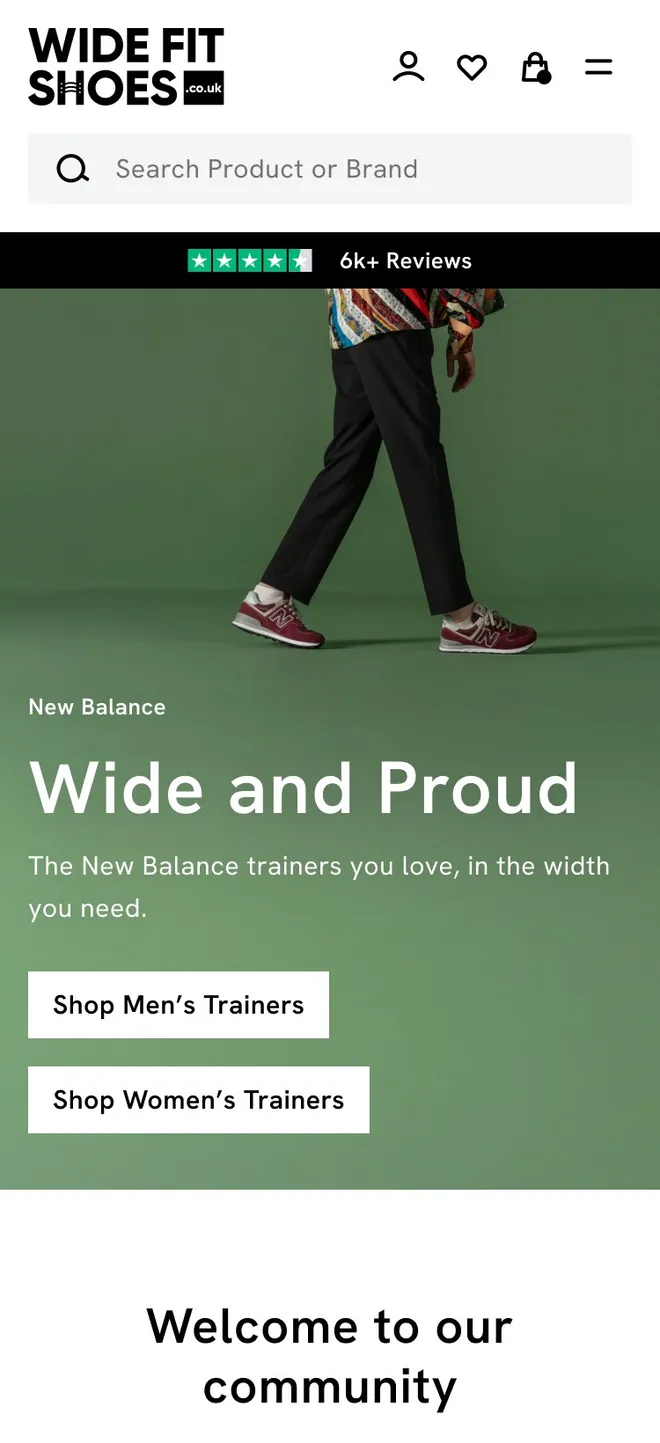
Fashion · August 2024
Product cards show width and colours before the click.

Stationery & gifts · June 2025
Landing pages by use, from business binders to pilot log books, help customers picture the product in their life.

Home · August 2024
Brand patterns carry key shopping messages through the store, in a way that's fun and memorable.

Fashion · 2025
"The increase in sales because of it." Jamie Lee, Owner

Food & drink
A gold and earth palette widened with neutrals, with gold kept for key actions.


East at Home's revenue rose 82% and its conversion rate 14%, comparing the eight months since launch, October to June, with the same period the year before (GA4, UK sessions). Drink Finder's website sales rose 34% and its customers 32% after moving to Shopify, from September to February against the year before, measured on EPoS till data with marketplace orders left out. Fuzzball's conversion rate rose 63%, August 2025 to August 2026 against the year before (GA4). Drink Finder won UK eCommerce Website of the Year and East at Home won UK User Experience of the Year at the UK eCommerce Awards 2026.
I compare the months since launch with the same months the year before, and show the change as a percentage with its window and source. The source is GA4 where the data is clean, or the client's till data where that's the more reliable record. The client approves every figure before it's published, and the same number appears everywhere it's used. No designer can promise a number, so I also check conversion rate and average order value at one, three and seven days after launch.
Some case studies don't show numbers because the client hasn't approved one yet, or the project is too recent to compare a full period fairly. Rather than publish a figure without its window, I show what changed for customers.
My Shopify case studies cover food and drink, wine and spirits, fashion, footwear, skincare, fragrance, homeware and textiles, pet food subscriptions, bespoke bookbinding, greeting cards and tea. I group them by service rather than sector, because a migration or a theme customisation raises the same questions whatever you sell.
Yes. Every store on this page is live. Clients keep developing their stores after launch, so today's store may have moved on from the design in the case study.
I reply within two working days.
Cookies
I use analytics cookies to see how people find and use this site. Nothing is tracked unless you accept.