


The short answer
A good conversion rate on Shopify is anything above 3.2%. That puts a store in the top 20%. The platform average is 1.4%, and above 4.7% puts you in the top 10%.
Those figures come from Littledata’s benchmark of 2,800 Shopify stores. They are a useful yardstick and a poor target, because your sector, your price point, your device mix and where your traffic comes from move the number more than anything on your site does.
Key takeaways
- The average Shopify conversion rate is 1.4%. Above 3.2% is the top 20%, above 4.7% is the top 10%.
- Mobile converts at 1.2% against 1.9% on desktop, and mobile is where most of the traffic sits.
- UK and Irish independent merchants averaged 2.23% in August 2026, up from 1.85% a year earlier, on 13.69% fewer visitors.
- Sector moves the number more than tactics do. Food and drink averaged 1.58% in August 2026, arts and crafts 5.81%.
- A realistic target is a 10% to 30% relative improvement over a few months, not a doubling.
What is a good conversion rate on Shopify?
Above 3.2% is good and above 4.7% is excellent. The average sits at 1.4%. These are Littledata’s Shopify-specific percentiles, taken from a benchmark of 2,800 stores, and they are the only widely published benchmark measuring Shopify on its own rather than ecommerce as a whole.
| Performance | Shopify conversion rate |
|---|---|
| Average | 1.4% |
| Top 20% | Above 3.2% |
| Top 10% | Above 4.7% |
| Average, mobile | 1.2% |
| Average, desktop | 1.9% |
| Top 10%, mobile | Above 3.9% |
| Top 10%, desktop | Above 6.5% |
Source: Littledata.
One caveat, because most articles quoting these numbers leave it out. Littledata’s benchmark is a 2023 dataset. It is still the most recent Shopify-only benchmark published anywhere, which is why everyone cites it, but it is not this year’s number. If you find a page quoting an updated Littledata study across several thousand more stores, check it against Littledata’s own page before you trust it.
Does a good conversion rate depend on your sector?
Yes, and more than most brands expect. In August 2026, arts and crafts stores across the UK and Ireland averaged 5.81% while baby and child averaged 0.57%. That is a tenfold spread inside the same month and the same dataset.
| Sector | Aug 2026 | Aug 2025 |
|---|---|---|
| Arts and crafts | 5.81% | 4.00% |
| Health and wellbeing | 3.31% | 3.30% |
| Kitchen and home appliances | 2.98% | 3.47% |
| Pet care | 2.56% | 2.62% |
| All markets | 2.23% | 1.85% |
| Sports and recreation | 2.11% | 1.57% |
| Cars and motorcycling | 1.86% | 1.27% |
| Fashion, clothing and accessories | 1.86% | 1.45% |
| Toys, games and collectables | 1.64% | 2.03% |
| Food and drink | 1.58% | 1.16% |
| Baby and child | 0.57% | 0.62% |
Source: IRP Commerce, August 2026.
Two things sit underneath any sector average. The first is price point. Lower priced, repeat purchase products convert higher, and considered purchases always convert lower because people research, compare and come back. Baby and child converts at 0.57% on an average order value of £855.57 (Prams are expensive!), which is a perfectly healthy business.
The second is traffic source. Returning customers convert far better than cold paid traffic, so scaling acquisition usually drags the headline rate down even when the site itself is performing better. Baby and child illustrates the first point well. Its conversion rate sits at 0.57%, the second lowest in the table, but its £855.57 average order value means each session is worth roughly £4.88, well above the £2.88 market average. The catch is that acquisition costs in that sector rose 26.83% year on year to August, faster than almost any other category, so the low conversion rate is not free to sustain.
Why is your mobile conversion rate lower than desktop?
Because most stores are still designed for desktop and then squeezed onto a phone. On Shopify, mobile averages 1.2% against 1.9% on desktop. The gap widens at the top, where the best 10% of stores manage more than 3.9% on mobile and more than 6.5% on desktop.
That matters because mobile is where the traffic is. In August 2026, mobile accounted for 63.7% of sales across UK and Irish independent merchants, desktop 34.7% and tablet 1.6%. If your mobile rate sits far below your desktop rate, the losses are concentrated on the majority of your visits.
The fix is rarely a mobile-specific patch bolted on at the end. It is designing the journey for a phone first and letting the desktop version inherit it.
Are you measuring the same number as the benchmark?
Almost every published benchmark counts sessions, not people. Conversion rate is transactions divided by sessions, multiplied by 100. If your own figure counts unique visitors instead, it will read higher for the same store, and comparing it to a session-based benchmark will flatter you.
IRP Commerce states its calculation openly: transactions divided by sessions, times 100. Littledata’s Shopify figures are session based too. Your Shopify dashboard reports by session, and GA4 can give you a different number again depending on how it has been set up.
Bot traffic is the other trap. Inflated session counts push a reported conversion rate down without anything changing on the site. I have worked on stores where the analytics were unusable for year-on-year comparison for that exact reason, and the only honest option was to benchmark against order data instead.
Before you decide your rate is poor, check you are comparing like with like.
Why is your conversion rate below the benchmark?
Usually it is not one broken thing. It is friction spread thinly across the journey.
Discovery is the first leak. If people cannot find the right product quickly they leave before they ever reach a product page, and large catalogues suffer most, because a stock theme menu was never built for thousands of products.
The product card is the second. People decide on collection pages far more than most brands realise, so a card that does not answer the question driving the decision forces everyone into a product page they did not need to open.
The third is cost surprise. Unclear delivery thresholds and charges that appear late kill more sales than any design detail.
I have written separately about the practical fixes.
What actually moves the number?
This is the part I can speak to from projects rather than theory.
Design the collection page around the decision
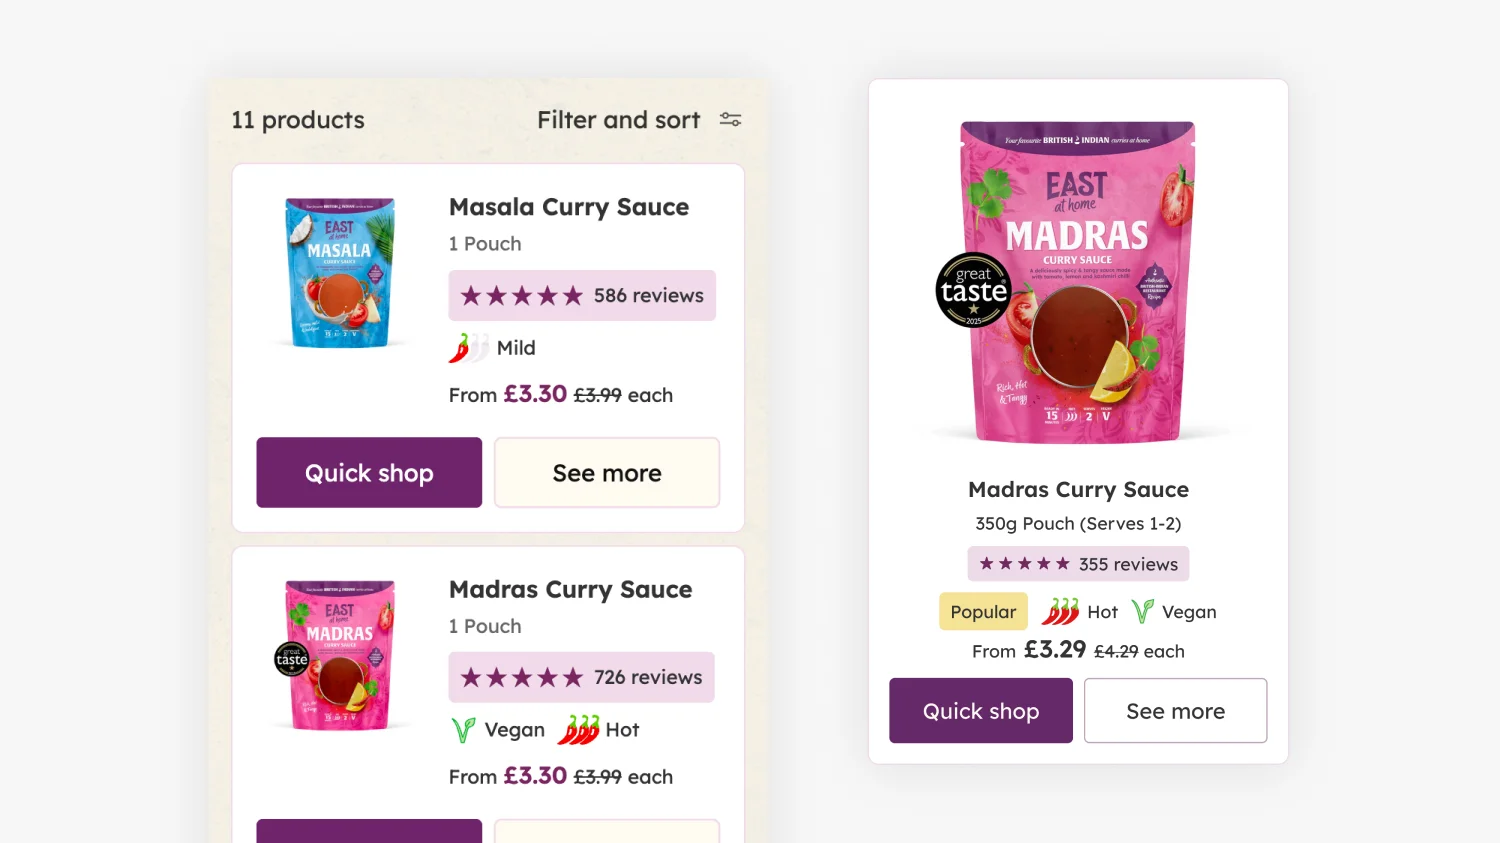
On East at Home, a DTC food brand, the collection pages were rebuilt around bespoke product cards that surface what actually drives the choice: spice level, dietary fit, flavour. A customer can compare the range without opening a single product page.
Conversion rate rose 14% from a base that was already well above sector average, and revenue grew 82% year on year.
Let people compare without leaving the listing
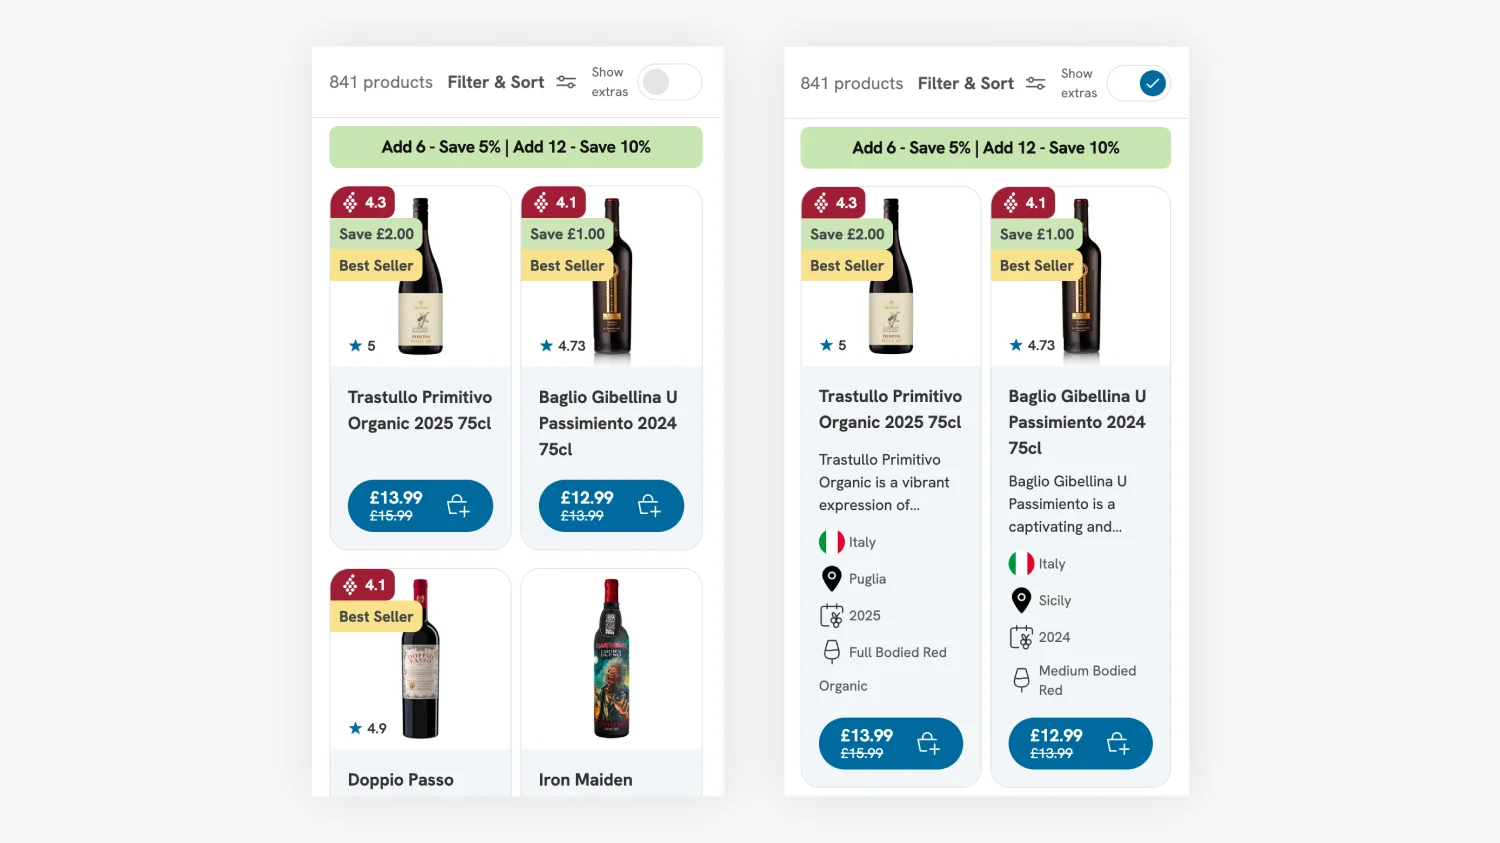
Drink Finder is a Cornish wine and spirits merchant with more than 5,000 products. I designed a comparison toggle that expands details like origin and age inside the listing, so shoppers can weigh bottles side by side before opening anything.
In a category where people compare constantly, that changed the browsing experience entirely. Website sales grew 34% and customer numbers grew 32% year on year, in a period when the premium drinks market was contracting.
Make the value of buying more visible at the moment of decision
Rather than fixed bundle variants, a quantity selector that recalculates the total, the saving and the price per unit live as the customer adjusts the amount. A basket progress bar shows what each threshold unlocks.
No countdown timers and no artificial scarcity anywhere in it. Order value rose through clarity.
Build navigation for the catalogue you actually have
A theme’s default menu will not cope with thousands of products. On the drinks project the mobile navigation was built from scratch rather than bent out of a generic component, and a catalogue that had been a barrier became calm to browse. Checkout starts rose 23% and add to basket actions rose 27%.
Map the journey before designing anything
Every one of those decisions came out of reviewing the purchase journey rather than instinct. The whole journey gets mapped, each step flagged where customers hesitate, and only then does design start. That is what a Shopify UX review is for.
What does not work?
Countdown timers and manufactured scarcity. They cost trust, and the lift fades as soon as customers recognise the pattern.
Discounting to fix a conversion problem. It hides the problem and teaches customers to wait.
Redesigning because the site looks dated. If you cannot say which step in the journey is losing people, a redesign is a gamble rather than a fix.
Copying a competitor’s layout. Their layout suits their catalogue, their price point and their customers.
How much improvement is realistic?
A 10% to 30% relative improvement over a few months is a good outcome for most stores. Moving from 1.5% to 1.8% sounds unremarkable and is worth a great deal of money on the same traffic.
Be sceptical of anyone promising to double it. Stores that see enormous jumps usually had something badly broken rather than something that needed optimising.
Allow four to six weeks after a change before judging the result, and longer if your traffic is modest. The market moves as well. Across UK and Irish independent merchants, visitor numbers fell 13.69% year on year in August 2026 while conversion rose 20.49% and revenue per session rose 24.65%. Fewer people are arriving and the ones who do are worth more. A store that only held flat against that was not standing still.
Where to start
Measure your rate by device and by traffic source before you measure it against anyone else. One blended number hides the problem. Split it and it usually points straight at it.
If you want it looked at properly, that is the work I do with DTC brands. More on Shopify conversion rate optimisation.
Frequently Asked Questions
1.4% across all stores, according to Littledata’s benchmark of 2,800 Shopify sites. Mobile averages 1.2% and desktop 1.9%. Sector and price point cause enormous variation, so treat the average as a reference point rather than a target.
2% is above the Shopify average of 1.4% and below the 3.2% that marks the top 20%. Whether it is good for your store depends on your sector, your price point and how much of your traffic is cold and paid.
Transactions divided by sessions, multiplied by 100. Sessions, not unique visitors. A visitor-based figure reads higher for the same store, so check which one a benchmark uses before comparing yourself to it.
That is normal. On Shopify, mobile averages 1.2% against 1.9% on desktop. A very large gap usually means the site was designed desktop first and squeezed down. Since mobile carries most of the traffic, closing that gap is often the single biggest opportunity.
Across UK and Irish independent merchants the average session conversion rate was 2.23% in August 2026, up from 1.85% a year earlier, according to IRP Commerce. That figure covers all platforms rather than Shopify alone, and it varies sharply by sector.
Allow four to six weeks after a change before the data means anything, and longer on modest traffic. A realistic outcome is a 10% to 30% relative improvement over a few months rather than a sudden jump.

This article was written by Anthony Bliss, a Shopify Expert & Freelance Shopify Designer specialising in UX and UI design for DTC brands. With 20+ years of design experience and 6+ years focused exclusively on Shopify, Anthony helps brands create stores that convert.
Let's create your Shopify success story
Shopify Success Stories

Shopify Migration with Custom & Conversion focussed UX
Drink Finder

Headless to Shopify Migration with a Luxury Premium Theme Build
Thameen London

Bespoke Store Design with Key AOV Results and Rise in Revenue
East At Home
More Shopify Articles

Shortlisted Four Times at the UK eCommerce Awards 2026
I have been shortlisted four times at the UK eCommerce Awards 2026, for my work with Drink Finder and East at Home, across four separate categories.
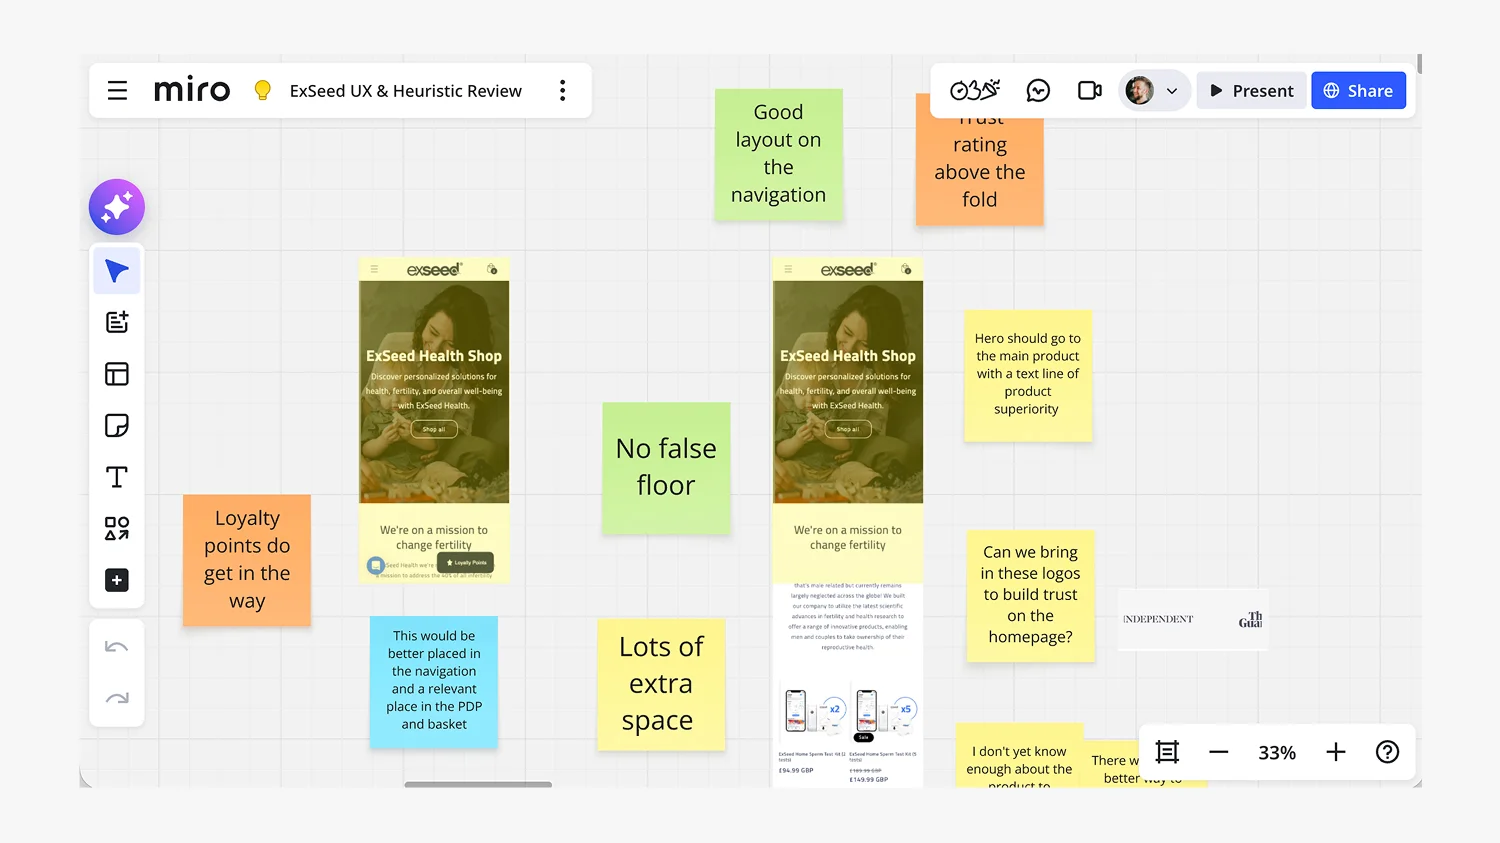
What Is a Shopify UX Review (And Why It’s Where Every Project Should Start)
A Shopify UX review is where every project should start, and yet most agencies skip it in favour of made-up personas and assumptions. This article…
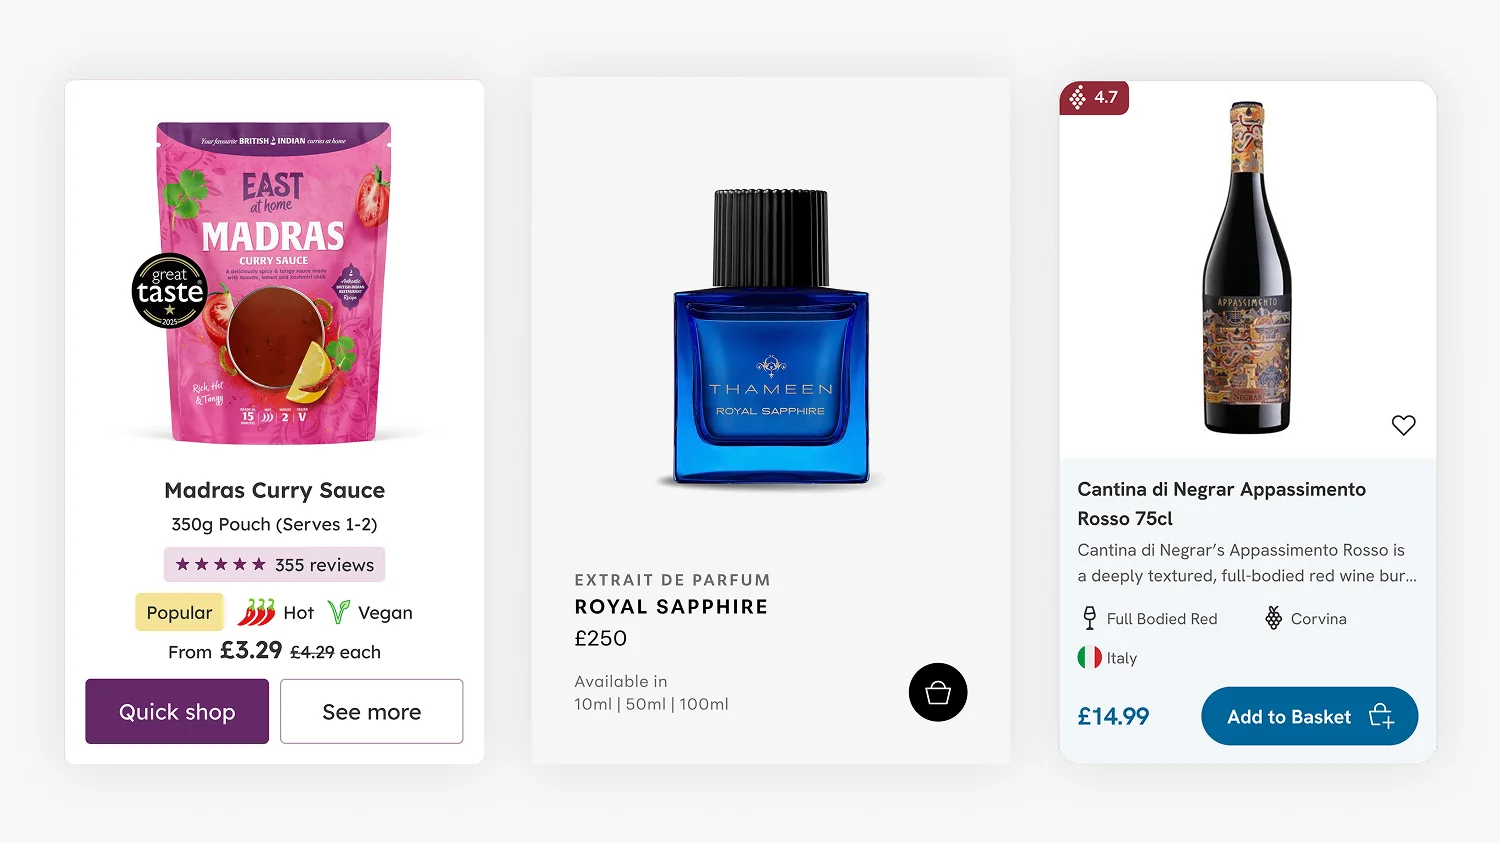
Shopify Product Card Design: The Art of Cards That Convert
Product cards are the most fundamental component of any ecommerce site, and the place where premium Shopify themes quietly underperform. When a theme…
Shopify Expert
Ready to build a Shopify store that performs as good as it looks?
Bespoke Shopify and Shopify Plus design, led by one UX/UI & CRO Specialist
20+ years of brand and design experience
A trusted network of the best Shopify developers, Klaviyo and SEO specialists for larger builds
This site is protected by reCAPTCHA and the Google Privacy Policy and Terms of Service apply.
Get in touch

Registered in England & Wales No. 10575474. Based in Falmouth, Cornwall, UK.